RoadBuddy provides independent information to help drivers compare auto insurance options with confidence. We may earn a commission when you click on partner links, but this never affects our reviews or recommendations. Our content is researched and published independently.
Why Your Car Insurance Keeps Going Up: The Hidden Factors Insurers Won’t Explain
Published 06.03.2026 | 18 min read
Advertiser Disclosure
RoadBuddy is a free resource that helps drivers compare auto insurance options.
We may receive compensation from some insurance companies and partners when you click on links or request a quote through our site. This may affect where offers appear, but it does not influence our reviews, guidance, or editorial decisions.
Our content is researched and written independently to give you clear and unbiased information.
By using RoadBuddy, you acknowledge and accept this disclosure. Learn more.
If your car insurance is going up and you feel like you did nothing to deserve it, you are not imagining things. One of the cleanest, least-spinnable signals is the federal Consumer Price Index line item for “motor vehicle insurance.” From 2021 to 2024, that index jumped from 565.3 to 843.1, a rise of roughly 49% in just three years. And in 2024 alone, motor vehicle insurance prices climbed 17.8% while overall inflation (CPI-U) was 2.9%.
That gap is the part insurers rarely explain in plain English. You can have no accidents, no tickets, no claims, and still get hit with an “insurance rates increase” that looks like 20%+ at renewal. People assume the bill is mostly about their driving. In reality, a huge chunk of premium increases are driven by cost factors you never see: repair severity, litigation and medical inflation, theft waves, catastrophe exposure, and carrier-wide profitability targets that get baked into rate filings.
This guide is an investigative breakdown of why the average car insurance cost keeps climbing, what’s actually inside the math, and which “market conditions” excuses are real versus convenient. The data backbone here comes from industry reporting and datasets (NAIC premium and loss data, ISO loss severity/frequency, and BLS inflation tables), plus pricing snapshots widely used by consumers and agents.
Most importantly, you’ll understand: what you can control (coverage selections, deductibles, limits, shopping cadence, vehicle choice) versus what is beyond your reach (state laws, regional loss trends, catastrophe losses, carrier underwriting cycles).
The State of Auto Insurance in 2026
By 2026, the national average car insurance bill is being shaped more by the economics of claims than by individual driving behavior. On the consumer pricing side, one large national pricing dataset puts the national average annual premium at $2,697 for full coverage. For a 2021 baseline, NAIC’s reported average auto insurance expenditure was $1,615. These figures are not built the same way, so they should not be treated as a perfect apples-to-apples comparison, but they do show the direction of travel: the typical cost to insure a vehicle has moved materially higher over a short period.
Insurance inflation is visible in broader price data as well. The CPI category for motor vehicle insurance rose sharply over recent years, including a 17.8% increase in 2024, which helps explain why many drivers saw large renewal jumps even without claims activity.
The industry performance metrics add important context to the “are insurers just taking profit” question. Loss ratios track how much of each premium dollar goes to claims, while the combined ratio adds operating expenses to that claims cost. When the combined ratio sits above 100, insurers are paying more in claims and expenses than they collect in premiums for that line of business, which is generally a sign of pricing inadequacy rather than excess profitability. NAIC/III data shows private passenger auto liability at a 111.3 combined ratio in 2022 and 101.2 in 2024, which suggests that recent rate actions have largely been aimed at closing the gap created by rising loss costs, even though those actions still feel like a punishment to individual drivers.
The state picture is uneven, which is why “car insurance going up” feels random from the driver’s seat. The same pricing dataset that estimates the national average shows some states sitting far above the national level and others well below it, reflecting differences in claim severity, medical costs, litigation patterns, theft exposure, weather risk, repair costs, and how state rules shape liability and injury payouts. The practical takeaway is that a rate increase can be driven by where you live and what is happening in that local claims environment, even when your personal risk profile has not changed.
Average annual full coverage premium in 2025 (state by state)
Generated by wpDataTables
Your Premium Anatomy: Where Your Money Goes
The car insurance price is formed like a simple budget. A typical premium is divided into claims, overhead, taxes and fees, and profit or surplus.
Claims (68%) is the money set aside to pay for crashes, theft, weather losses, and injury settlements.
Overhead (25%) covers the cost of operating and regulating the business, including underwriting, customer service, claims handling, fraud prevention, and systems.
Taxes (2%) are state-required charges.
The profit (5%) slice is smaller than most people assume, but it matters because insurers have to maintain reserves and remain solvent when loss years hit.
Moreover, a practical car insurance premium breakdown has two layers: what your policy pays for (liability, collision, comprehensive) and how your premium is allocated across costs. Liability covers injuries and property damage you cause to others, collision covers damage to your own car from a crash, and comprehensive covers non-collision losses like theft, hail, vandalism, or animal strikes.
Your insurance cost allocation is also shaped by state rules. In no-fault states, more medical costs are routed through first-party benefits like PIP, which can increase the medical portion of the premium even when liability limits look similar. In tort states, injury costs more often flow through liability claims and lawsuits, which can shift the mix toward bodily injury liability.
The Obvious Culprits (What Insurers Will Tell You)
Your Driving Record
Insurers will always start with the stuff you can see on paper: accidents, tickets, and prior claims history. An at-fault crash is the clearest “accident insurance increase” trigger because it signals both higher expected payout costs and a higher probability of another loss. Most companies rate accidents for roughly three to five years, but the exact lookback is a mix of state rules and carrier underwriting, which is why two drivers with the same accident can see different timelines for how long it affects their bill.
Not-at-fault accidents are where consumers feel the system is unfair, and insurers rarely explain the mechanism. Even when you were hit by someone else, the event can still show up in underwriting databases and be used in “claims history scoring,” because insurers treat prior involvement in losses as a predictive signal, especially when there is a pattern or when claims handling costs are high in the state. Separate from accident fault, insurers also pull claim history reports that can keep items on file for up to seven years, which means a small claim can follow you longer than most people expect.
Impact of Violations on Insurance Rates and Record Duration
Generated by wpDataTables
Finally, insurers care about frequency because it is one of the strongest internal predictors of future claims costs. Two small claims can look worse than one larger claim because frequency suggests repeated exposure to loss events and repeated claim handling expense, which is why some drivers see their rates rise more after multiple minor incidents than after a single expensive, clearly one-off loss.
Life and Vehicle Changes
🎯 Car Insurance Risk Profile Quiz
5 questions · 2 minutes · Find out if your current coverage matches your actual risk level
Question 1 of 5
How many miles do you drive per year?
Higher mileage = more time on road = higher statistical accident exposure
Question 2 of 5
Where do you primarily drive?
Urban environments have 3× higher accident frequency than rural roads
Question 3 of 5
Who else regularly drives your vehicle(s)?
Adding a driver under 25 can increase household risk exposure by up to 3×
Question 4 of 5
What does your driving record look like over the last 3 years?
One at-fault accident typically raises premiums 20–40% — and the risk profile that caused it doesn't disappear
Question 5 of 5
What type of vehicle do you primarily drive?
Vehicle value, size, and repair complexity directly affect both your claim exposure and liability risk
0
out of 15
Low Risk
Low Risk Driver
Your driving profile presents a low risk exposure.
📋 Your Coverage Recommendation
Bodily Injury
50/100
Property Damage
$50,000
UM / UIM
Match BI
Umbrella Policy
Optional
🔍 Get Quotes for My Risk Profile
Compare carriers based on your specific risk level — free, no obligation
⚠️ Results are for educational purposes only and do not constitute personalized insurance advice. Consult a licensed insurance professional for a coverage recommendation specific to your situation.
A lot of “moved insurance increase” stories are done by your risk profile being recalculated after a life or vehicle update. Adding a new driver, especially in the 16 to 25 range, is one of the biggest rate impacts because insurers price that bracket as higher frequency and higher severity, even if the teen barely drives. A new or newer vehicle can raise vehicle insurance costs because the payout exposure is higher, parts and labor are more expensive, and theft risk is often higher for popular models, while advanced sensors can turn minor bumps into major repair bills. Older cars do not always mean cheaper premiums, because liability pricing can dominate the bill and some older models still generate expensive claims or higher theft rates. Moving addresses triggers zip code rating territories, which reassigns you to a different loss environment. Mileage matters too, because insurers rate in annual mileage bands and more miles usually means more exposure. Finally, coverage increases you requested, like higher limits or adding comp and collision, will raise the premium because you expanded what the policy must pay for.
Coverage and Policy Adjustments
A rate jump is often tied to what your policy is promising to pay, not just what happened on the road. If you raise your coverage limits, the insurer’s maximum payout grows, so the price usually follows. The same thing happens when you lower your deductible, because you are shifting more of each loss from “you pay first” to “the company pays first,” which increases expected claim costs. Adding collision and comprehensive back onto a car, increasing rental reimbursement, or selecting broader add-ons can move the needle for the same reason: you expanded the scenarios where the policy writes a check.
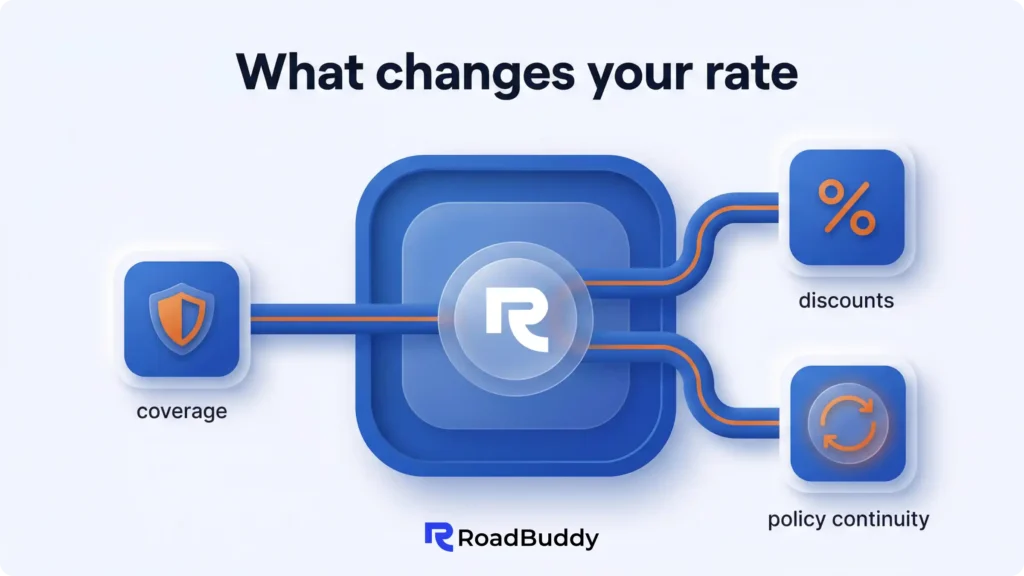
Gaps in coverage can be even more expensive than people expect. A lapse, even a short one, often triggers reinstatement penalties and places you into a higher-priced tier because insurers treat continuous insurance as a stability signal. Another quiet driver is discount churn: you can lose pricing credits after a move, after leaving a student program, after changing how you pay, or after no longer meeting eligibility for a safe-driver or telematics discount.
Bundling works the same way in reverse. If you separate auto from home/renters, or remove a second vehicle, the multi-policy discount can disappear. Finally, vehicle use is a pricing input: switching to business use or ride-share typically increases rates because the car is on the road more, used in riskier conditions, and statistically produces different claim patterns.
The Hidden Factors (What Car Insurance Providers Don’t Advertise)
Credit-Based Insurance Scoring
Credit-based insurance scoring is separate from your FICO, even though it uses similar credit report inputs. Insurers run those signals through proprietary models (LexisNexis Attract is a common example) to predict claims likelihood, and they typically do not itemize it on your renewal because the score is embedded inside rating and the model is treated as confidential.
The parts that usually matter most are payment history, outstanding debt and credit utilization, length of credit history, pursuit of new credit, and credit mix. That is why “silent” changes can move your rate: a closed account, a lower credit limit, higher utilization, or a missed payment can shift the insurance score even when nothing about your driving changed. How big is the impact in practice depends on the state and carrier, but large pricing analyses regularly find very large gaps between excellent and poor credit tiers, sometimes well over 50%.
Neighborhood Risk Scoring
Zip code insurance rates are often a shorthand for something more granular. Many insurers build rating territories that can be smaller than a ZIP code and, in modern pricing, can incorporate geodemographic and environmental variables at levels like census tract, block group, or other micro-territories tied to historical loss experience. That is why moving one mile, switching where you park overnight, or crossing a boundary that looks meaningless on a map can change your rate in a way that feels arbitrary, because you may have moved into a different loss-cost cluster.
What drives the difference is not just crime rates, although auto theft rates, vandalism, and hit-and-run frequency are real inputs that show up in comprehensive and collision losses. Neighborhood pricing can also reflect the local litigation environment and claim handling patterns, because some areas produce more attorney involvement and higher settlement costs, which pushes up expected loss severity.

Weather and environmental exposure sits in the same model family, including hail-prone zones, flood risk, and even wildlife collision corridors, because those events are geographically concentrated and repeatable in the data. This is also where “insurance redlining” concerns show up in public debate, since location-based pricing can overlap with demographic patterns even when insurers frame it as pure risk modeling.
Make Sure You’re Not Overpaying
You’ll be redirected to our partner’s site to get offers.
Advertiser Disclosure
RoadBuddy is a free resource that helps drivers compare auto insurance options.
We may receive compensation from some insurance companies and partners when you click on links or request a quote through our site. This may affect where offers appear, but it does not influence our reviews, guidance, or editorial decisions.
Our content is researched and written independently to give you clear and unbiased information.
By using RoadBuddy, you acknowledge and accept this disclosure. Learn more.
The “Invisibility” of Price Optimization
Risk based pricing is the version insurers talk about because it sounds fair: your rate reflects expected losses and expenses for your driver profile. Price optimization is the quieter cousin that regulators keep side-eyeing, because it is about what you are likely to tolerate, not what you are likely to cost. In practice, it means layering consumer behavior signals into pricing, such as renewal stickiness, brand loyalty indicators, and the probability you will shop around, then setting the premium closer to the highest number the model thinks you will pay without leaving. Regulators object because two people who look similar on risk can end up with different outcomes based on behavior scoring rather than loss expectation.
Several states have explicitly told insurers to stop using price optimization in personal auto pricing, including California, Florida, Maryland, Ohio, Rhode Island, and Vermont. The consumer facing effect is the loyalty penalty: if a carrier thinks you will not re-quote, the renewal increase can be less restrained than it would be for someone who looks more likely to walk.
Insurance Score vs. Driving Record
Your driving record is only one input. Many insurers also generate an internal “insurance score” that blends multiple signals into a single risk marker, and it can move your price even when your MVR looks clean. Part of that score comes from databases like CLUE (Comprehensive Loss Underwriting Exchange), which is basically an insurance-industry claims history file. CLUE reports can include up to seven years of auto claims and details like dates of loss, claim type, and whether anything was paid out, and insurers use it for underwriting and pricing decisions.
You can access your own CLUE file and check what insurers are seeing. Under the Fair Credit Reporting Act you are entitled to a free copy, and state regulators commonly point consumers to the LexisNexis Consumer Center request process. If something is wrong, LexisNexis has a formal dispute and reinvestigation process, which matters because a misreported claim or duplicate entry can create rate differences that have nothing to do with your actual driving.
Beyond claims, some states allow additional “stability” variables that are not driving related. The NAIC notes that factors like homeownership, occupation, and education are sometimes used in pricing in certain states, which is why insurance score is not the same as a credit score and not the same as a driving record either.
Social and Demographic Factors
A lot of demographic insurance pricing sits in the uncomfortable zone between “actuarially justified” and “feels like profiling.” Insurers argue these variables work because they correlate with loss frequency or loss severity across large groups, and regulators care about whether the factor is predictive rather than simply convenient. The NAIC’s consumer materials list age, driving experience, gender, and marital status as common pricing inputs where state law allows them, which is why two drivers with identical cars and clean records can still land in different tiers.
Impact of Age on Insurance Rates
Generated by wpDataTables
Gender is allowed in most states, but there are important exceptions. California explicitly prohibits gender in private passenger auto rating, and North Carolina law bars rating plans from using age or sex for private passenger auto. Several other states also restrict or prohibit gender use, while Montana is a reminder that these rules can change because its prior unisex approach was rolled back by a 2021 law.
Marital status and homeownership are often treated as “stability” signals, and some markets also use education or employment-related variables, which is where the fair pricing vs discrimination debate stays active.
Car Insurance Industry-Wide Forces (Beyond Your Control)
Medical Cost Inflation
Auto insurance feels different because the inflation that matters most is medical. A crash claim is often an ER visit, imaging, specialist follow-ups, physical therapy, and months of treatment priced like hospital care, and those costs flow through multiple parts of a policy: bodily injury liability when you injure someone else, PIP in no-fault states where your insurer pays first, and MedPay where it is offered.
Medical costs have been rising faster than overall inflation, especially on the hospital side, so insurers are watching the expected payout per injury claim climb even when crash counts do not change much.
On top of the base cost of care, some markets see added pressure from provider liens, extended treatment plans, and legal strategies that increase medical bills inside settlements, and those patterns get priced in at renewal because insurers assume the next injury claim will be more expensive than the last.
Litigation and Social Inflation
“Social inflation” is the industry term for liability costs rising faster than normal economic inflation because the legal system is producing larger settlements, higher defense costs, and more frequent high-dollar outcomes. The short version is that insurers are pricing not only the crash, but also the legal environment around the crash, including how often attorneys get involved, how aggressively cases are pursued, and what juries are willing to award.
A big driver is the growth of “nuclear verdicts,” typically defined as jury awards over $10 million, which raises the ceiling on what a severe injury claim can cost even before it reaches a courtroom. Trial tactics like the “reptile theory,” high initial demands that anchor negotiations, and third-party litigation funding all add pressure by changing how cases are valued and how long they stay in the system. You can see how this spills into auto-related cases with major awards tied to crashes and injury disputes, such as the Tesla Autopilot verdict reported in 2025. Because auto insurance is pooled risk, these costs do not stay isolated to “other people’s lawsuits”; they get spread across a state’s book of business through higher expected claim severity.
Vehicle Repair Cost Explosion
Repair costs have become a structural driver of premium increases because modern cars are more expensive to fix, even when the damage looks minor. Parts pricing and availability still matter, but the bigger shift is complexity: more sensors, more electronics, more software, and more steps that cannot be skipped if a shop wants the car to drive correctly afterward. That is where advanced driver assistance systems (ADAS) show up, because a bumper that used to be plastic and paint now often houses sensors that need calibration after a hit.
Industry repair data has documented how common this has become. One widely cited Mitchell figure, highlighted in reporting on ADAS-related repair inflation, found that in 2024 about 26% of insurance repairs included sensor recalibration, up from 5% in 2020, and that recalibrations added around $500 on average. This stacks on top of labor rate increases driven by technician shortages and the tendency for insurers and manufacturers to prefer OEM parts on late-model vehicles, especially when safety systems are involved. The result is that collision claim costs rise through diagnostics, programming, calibration, and higher parts-and-labor totals, which is consistent with the broader trend of property damage severity climbing in recent years.
Vehicle Theft Epidemic
Auto theft is one of the clearest examples of how pricing can move even when your driving stays the same, because it loads directly into comprehensive coverage. Comprehensive is the part that pays for theft and vandalism, so when theft climbs in a region, insurers see higher claim counts and higher average payouts, and they reprice that portion of the policy first. It can still spill into collision costs in a roundabout way, since recovered vehicles are often damaged, stripped, or dumped after a crash, which turns a “theft” file into a large repair bill and extended rental time.
The 10 most stolen vehicles of 2025 by make and model:
- Hyundai Elantra: Reported stolen 11,329 times
- Hyundai Sonata: Reported stolen 9,154 times
- Honda Accord: Reported stolen 8,531 times
- Chevrolet Silverado 1500: Reported stolen 8,006 times
- Honda Civic: Reported stolen 6,396 times
- Kia Optima: Reported stolen 6,011 times
- Ford F150: Reported stolen 4,996 times
- Toyota Camry: Reported stolen 4,986 times
- Honda CR-V: Reported stolen 4,889 times
- Kia Soul: Reported stolen 4,380 times
The risk is also model-specific, which is why neighbors can pay different rates for similar limits. National theft data shows certain vehicles repeatedly sitting at the top of the list, including Hyundai and Kia models that became popular targets during the viral theft trend tied to missing immobilizers on many older model years.
Natural Disaster Frequency
Weather losses hit auto insurance through comprehensive, and the industry has been seeing more of the kind of storms that generate mass claims in a short time. NOAA tracks “billion dollar” U.S. weather and climate disasters, and the trend line shows these events have become a regular feature rather than a rare shock. In 2023, the U.S. recorded 28 separate billion dollar disasters, which is the kind of year that forces insurers to revisit how they price weather exposure in multiple states at once.
Hail is one of the most direct examples for drivers because it is a high-frequency comprehensive claim in specific corridors, especially across parts of Texas, Colorado, and Oklahoma. When a storm drops golf-ball hail across a metro area, the claim is rarely “just dents” anymore, because modern body panels, glass, paint, and sensor-equipped bumpers are expensive to restore, and insurers see the severity climb along with the claim count.
Five States By Number Of Major Hail Events
Generated by wpDataTables
Source: Insurance Information Institute
Flooding is another rate driver because water intrusion often turns into a total loss decision, especially when electronics and safety systems are affected. Wildfires add their own pattern, including direct fire damage and smoke damage, which comprehensive typically covers.
Uninsured Motorist Problem
UM/UIM gets more expensive when more people drive around without enough liability insurance, because the costs do not vanish when an uninsured driver causes a crash. They shift. If the at-fault driver cannot pay, the injured person still needs medical care and their car still needs repairs, and that loss often lands on the victim’s own policy through uninsured or underinsured motorist coverage. As the uninsured driver rate rises in a state, UM/UIM becomes a coverage line that pays out more often, which is why your UM/UIM premiums can climb even when you have never used it.
Hit-and-run crashes intensify the same problem. If the driver is never found, the claim can function like an uninsured loss and may still get paid under UM in many states, which increases the frequency and cost insurers have to price for. Economic pressure also feeds the cycle because more drivers let policies lapse when budgets tighten, especially if they are already paying high premiums.
States respond with insurance verification programs and enforcement tools, but results are mixed because uninsured driving is partly an enforcement problem and partly an affordability problem. When insurance gets expensive, more people drop it, and that pushes more cost onto the insured pool.
Distracted Driving and Risk Behavior
Fatal Crashes Involving Distracted Drivers
Source: U.S. Department of Transportation, National Highway Traffic Safety Administration.
Generated by wpDataTables
Safer cars have not produced cheaper insurance because safety features do not eliminate crashes, and they do not eliminate human behavior. Distracted driving creates collisions where the driver reacts late or not at all, which increases impact speed and pushes up both injury costs and repair bills. The same is true for aggressive driving and speeding, which increase severity even if the total number of crashes does not explode.
There is also a modern paradox: the technology that can help avoid a crash often makes the repair more expensive when a crash still happens. Sensors, cameras, and calibration requirements turn minor impacts into larger claims, so the market can see higher average claim costs even while vehicles are getting smarter.
The Hidden Cost Layer: What is Reinsurance and Why You Pay For It
Reinsurance is insurance for insurance companies. Your carrier buys it so one ugly year of hurricanes, hail, floods, or wildfire smoke does not wipe out its balance sheet, and so it can keep writing policies even when catastrophe losses stack up. When reinsurance costs rise, that cost shows up in the rate math, because it is part of what it takes for an insurer to safely promise to pay future claims.
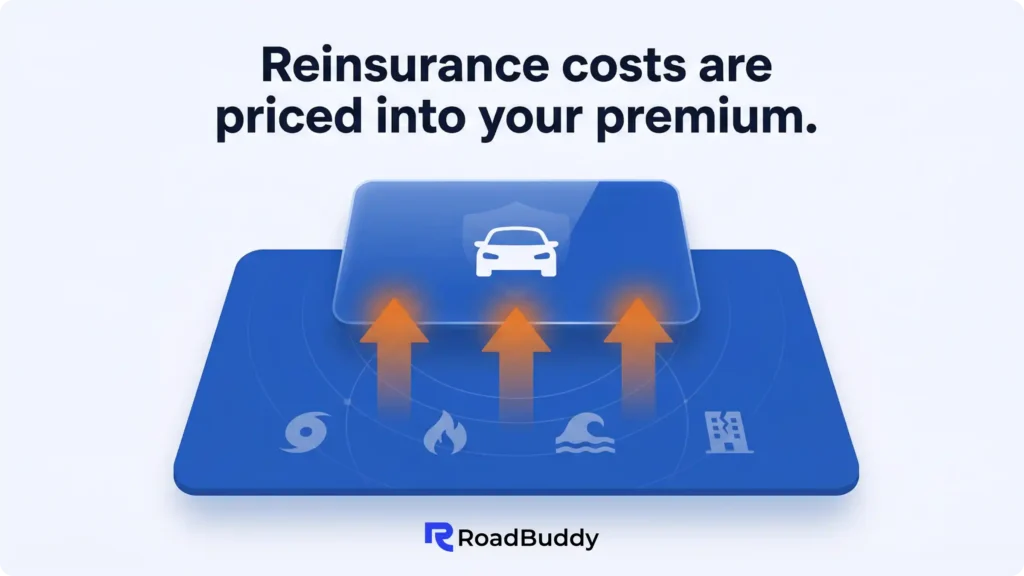
There are two common forms. Treaty reinsurance is the long-term, broad agreement that covers a whole slice of an insurer’s book (think “all auto comprehensive losses above X”). Facultative reinsurance is the one-off version used for specific risks or situations when a company wants extra protection beyond its normal treaty program.
Why did reinsurance rates spike after 2021? The market got hit with repeated, high-severity catastrophe years, higher repair and replacement costs, and tighter capacity as reinsurers demanded better terms and higher prices to take the risk. Industry renewals from 2024 through early 2026 still reflect that reset, even as some property-cat pricing began softening once capital returned and terms stabilized.
State Regulatory Environment: How Rate Approval Works (Or Doesn’t)
Each state decides how much freedom insurers have to change prices, and that choice is a big reason why the same “market conditions” story produces very different outcomes depending on where you live. Regulators generally fall into a few buckets: prior approval (the company must justify the increase before it can use it), file-and-use or use-and-file (the company can implement rates with filing and later review), and no-file/open competition (market-based pricing with minimal front-end review).
Your Car Insurance Switching Timeline
Four interactive tools to help you figure out when to switch, how much you'll save, whether a life event triggers a switch, and the exact steps to make it happen.
When Should You Switch? — Visual Timeline
Click any phase to see what to do and why it matters. The ideal switch window is 20–30 days before renewal.
Mid-Term Switch Savings Calculator
Find out whether it makes financial sense to switch now or wait until renewal. Enter your numbers below.
Current Annual Premium
$
New Quote (Annual)
$
Months Left on Policy
Cancellation Fee (if any)
$
—
Annual Savings
—
Savings This Term
—
Net After Fees
Life Event Trigger Checker
Select every life change that applies to you. We'll tell you whether you should switch now, soon, or stay put.
Step-by-Step Switching Checklist
Click each step to mark it done. Complete all steps to switch without gaps in coverage.
0 of 9 steps done0%
🔍 Ready to Make Your Move?
Compare Real Quotes from 50+ US Insurers
Drivers who shop around save an average of $687/year. It takes 2 minutes and is 100% free.
No spam calls
Instant online quotes
All 50 states covered
Zero obligation
By clicking you agree to our Terms. No purchase required.
Prior approval states usually offer the strongest consumer protections on paper because regulators can demand support before a hike takes effect, and in some states the public can formally challenge proposed increases. California is the best-known example, where Proposition 103 is explicitly a prior approval system and includes a consumer intervenor process tied to rate filings.
In more competitive systems, the check often happens after the fact. Florida’s rules, for example, allow “file and use” or “use and file” approaches and give the regulator authority to disapprove rates found excessive, inadequate, or unfairly discriminatory, including the ability to require refunds in certain situations.
However, strong rules mean nothing if review is slow, under-resourced, or overly deferential, and the most effective pressure valve for consumers is often the ability to intervene, submit objections, and force a real record in a rate proceeding.
Make Sure You’re Not Overpaying
You’ll be redirected to our partner’s site to get offers.
Advertiser Disclosure
RoadBuddy is a free resource that helps drivers compare auto insurance options.
We may receive compensation from some insurance companies and partners when you click on links or request a quote through our site. This may affect where offers appear, but it does not influence our reviews, guidance, or editorial decisions.
Our content is researched and written independently to give you clear and unbiased information.
By using RoadBuddy, you acknowledge and accept this disclosure. Learn more.
Market Competition by State
How much you pay is not only about risk, it is also about how much real competition exists where you live. In states with lots of carrier options, insurers have to price more aggressively to win and keep business, especially for “preferred” drivers. In states with fewer active writers, a lot of consumers end up cycling between the same small group of companies, which makes it easier for rates to stay elevated because there is less pressure to undercut the market.
Market concentration is easiest to see through market share. NAIC market-share reports show that, in every state, a small set of groups typically controls a large portion of private passenger auto premium, and the “top 10 by state” snapshot is one of the clearest ways to see when choices are broad versus when the market is dominated by a few names. At the national level, the same pattern holds: the largest writers capture a meaningful share of the entire private passenger auto market.
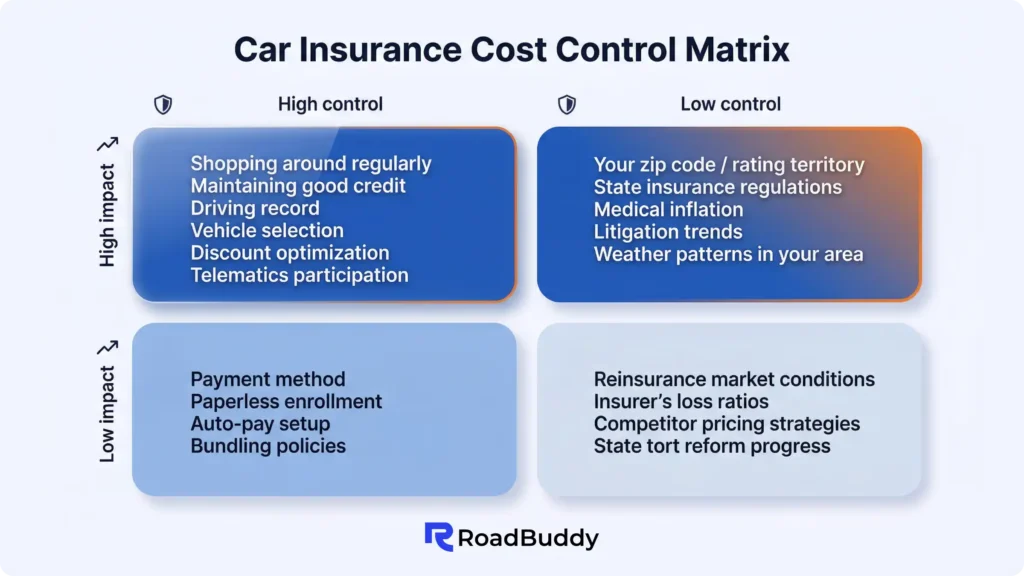
What You Can vs. Can’t Control: Car Insurance Cost Control Matrix
A lot of the factors affecting car insurance are low-control: your state’s claims costs, repair and medical inflation, weather losses, uninsured driving, and insurer repricing cycles. You cannot fix those, and it is normal to feel like you are paying for everyone else’s problems.
To reduce insurance rates, focus on high-control levers that change the math: deductible choice, whether comp and collision still make sense for your car’s value, higher or lower liability limits, keeping continuous coverage to avoid lapse penalties, mileage bands, and shopping quotes before renewal instead of after the increase hits. That is where effort reliably translates into lower cost.
The Demographics You Can’t Change
Some pricing inputs are effectively fixed for long stretches, and insurers treat them as long-run risk signals rather than something you can “offset” with a single clean renewal. Age is the obvious one. Rates are typically highest for brand-new and young drivers, then tend to ease as experience accumulates, with many people seeing noticeable improvement around the mid-20s and more stability through their 30s, 40s, and 50s. There is no universal switch at 25, 35, or 55, but those checkpoints often line up with how insurers model experience and loss patterns, so the rate decrease timeline usually looks gradual rather than dramatic.
Gender depends almost entirely on your state’s rules. In states that prohibit gender-based rating, it simply does not move the number. In states that allow it, the impact is usually smaller than bigger drivers like driving record, territory, vehicle costs, and credit-based insurance scoring where permitted. Marital status is the one “demographic” people forget to update. If your insurer offers a married rate and your status changed, updating it can matter, but the pricing effect often shows up at the next renewal rather than immediately.
Investigating Your Car Insurance Cost Increase
How to Decode Your Rate Increase Notice
Treat the renewal premium increase like an audit. Compare your old declarations page to the new one and look for coverage changes that can quietly raise the price: higher limits, a lower deductible, added comp/collision or endorsements, or a vehicle-use change. These often appear as “updates,” not as a clear explanation.
Next, check the discount and surcharge areas. Many increases come from removed discounts (bundle, telematics/safe driver, low-mileage, good student, payment method, paperless) rather than a single big event. Then look for itemized surcharges or violation fees tied to an accident or ticket, because those sometimes show up even when the letter stays generic. If you can, separate what looks like a base rate change from what is clearly a surcharge so you know what is market-wide versus personal.
If anything looks wrong, pull the underlying records. Request your MVR motor vehicle report from the DMV, your claim history report (CLUE), and your insurance history report for lapses. If you find an error, dispute it with the source (DMV or LexisNexis) and ask your insurer for a re-rate after the correction posts.
Make Sure You’re Not Overpaying
You’ll be redirected to our partner’s site to get offers.
Advertiser Disclosure
RoadBuddy is a free resource that helps drivers compare auto insurance options.
We may receive compensation from some insurance companies and partners when you click on links or request a quote through our site. This may affect where offers appear, but it does not influence our reviews, guidance, or editorial decisions.
Our content is researched and written independently to give you clear and unbiased information.
By using RoadBuddy, you acknowledge and accept this disclosure. Learn more.
Disputing Errors and Inaccuracies
Do not start with “my rate is too high.” Start with one specific issue: a claim you never filed, a wrong accident/ticket, an incorrect lapse date, the wrong garaging address, or a driver/vehicle listed incorrectly.
Save the renewal notice, the old and new declarations pages, and any page that shows removed discounts or surcharges. Keep screenshots or PDFs. If it is an accident or ticket issue, pull your MVR from the DMV. If it is a claim issue, pull your claims history report (CLUE). If it is a lapse issue, gather prior policy documents and payment confirmations.
Create a simple log: date, time, who you spoke to, what they said, and what they promised. Save emails and chat transcripts. If you mail anything, keep copies.
Send a short, factual message that includes: the exact error, the supporting documents, and a direct request for correction and re-rating. Ask them to confirm which record they relied on (MVR, CLUE/claims history, prior insurance verification, underwriting report).
If the insurer’s data comes from a third party, you usually have to correct it at the source. DMV errors get fixed at the DMV. CLUE/claims history errors go through LexisNexis. Once corrected, request written confirmation so the insurer can re-rate.
After the correction posts, ask the insurer to re-run underwriting and pricing and send an updated renewal quote in writing. This is the step that actually changes the premium.
If the carrier stalls, denies without addressing the evidence, or refuses to correct an obvious mistake, file a consumer complaint with your state insurance department/commissioner. Attach your documentation and the timeline. The regulator cannot force a company to underwrite you, but they can require a response and review whether rules and procedures were followed.
If the error caused a specific financial loss you can prove, small claims court can be a last step, but it is usually slower and less predictable than getting the record corrected and the policy re-rated.
When to Negotiate vs. When to Switch Your Insurance Provider
Negotiation Strategies That Work
In most states, the base rate is filed and rules-based, so the real levers are a rate review, a discount audit, and a re-rating if any inputs are wrong or outdated. Some carriers can add a retention discount, but it is not guaranteed and it is often tightly limited.
The best timing is 30 to 45 days before renewal, when changes can still be processed and you still have time to shop. The only leverage insurers consistently take seriously is a comparable competitive quote, meaning the same limits and deductibles. Otherwise, it looks like you are comparing different products.
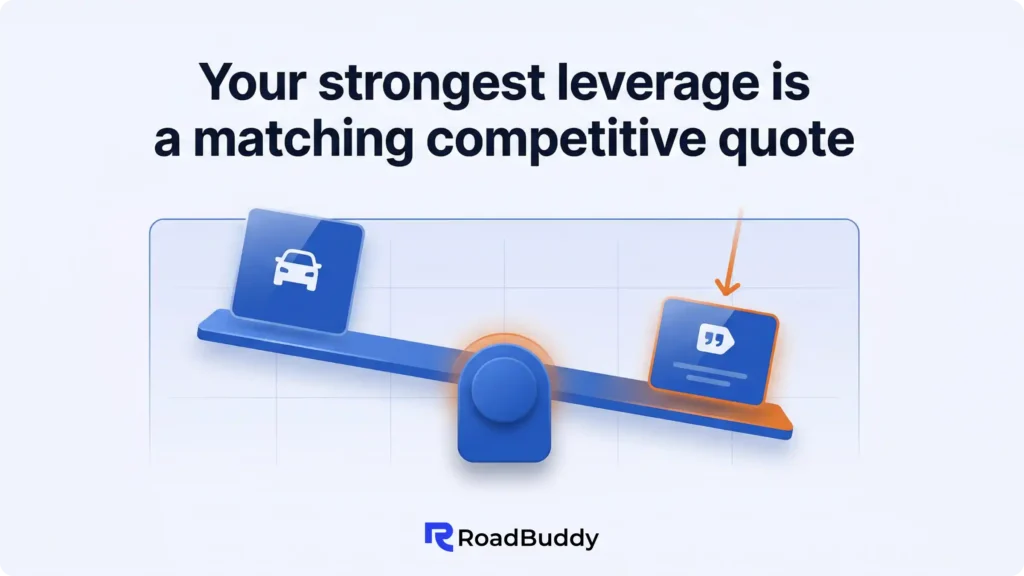
What to ask for: confirmation that your mileage band, garaging address, drivers, continuous coverage status, and discounts are coded correctly, plus whether any loyalty or retention credits are available. It tends to work for long-tenure, clean-record customers, and it tends to fail when the increase is driven by a surcharge, a lapse, or a broad state-wide repricing.
The Cost-Benefit of Switching
Switching car insurance can save real money, but only if you measure the true annual savings. The cost of switching insurance is mostly friction and risk. It takes time to re-quote and verify details, and a sloppy switch can create coverage gaps that insurers treat harshly later. Some carriers charge cancellation fees depending on state rules and policy terms, and you can give up tenure discounts, accident forgiveness, or other loyalty-based perks that only apply after multiple renewals.
When to Switch vs. When to Stay
| When to Switch | When to Stay |
|---|---|
| Rate increase >15% without cause | Rate increase is market-wide and proportionate |
| Better coverage for less money | Strong claims history with current carrier |
| Poor claims service experience | Near renewal discount milestones |
| Insurer financial instability | Accident forgiveness or other valuable features |
| Life change makes you a better fit for a different carrier | Only 5-10% savings available elsewhere |
Make Sure You’re Not Overpaying
You’ll be redirected to our partner’s site to get offers.
Advertiser Disclosure
RoadBuddy is a free resource that helps drivers compare auto insurance options.
We may receive compensation from some insurance companies and partners when you click on links or request a quote through our site. This may affect where offers appear, but it does not influence our reviews, guidance, or editorial decisions.
Our content is researched and written independently to give you clear and unbiased information.
By using RoadBuddy, you acknowledge and accept this disclosure. Learn more.
The Hidden Costs of Staying
Many carriers reserve their sharpest pricing for acquisition, which is why new customer discounts exist at all. Over time, a portion of customers experience a car insurance loyalty penalty in the form of renewal pricing that drifts upward even when nothing material changed on the policy. The easiest way to test whether this is happening to you is to run a controlled comparison. Quote your current coverage as if you are a new customer (same limits, same deductibles, same vehicles, same mileage), then compare it to your renewal offer. If the new quote comes in meaningfully lower, you have identified the spread you are paying for staying put. If it is similar, the increase is more likely market-driven rather than a loyalty issue.
To calculate the 5-year loyalty cost, treat the difference like a subscription tax. Take your annual premium, apply a modest “creep” assumption of 3% to 5% per year, and compare that five-year total to what you would pay if you periodically reset your pricing by shopping and switching when the gap is large. Even small percentage differences compound quickly, which is why long term customer insurance costs can quietly exceed what many drivers would consider reasonable if they saw the total laid out in one number.
Industry Transparency Issues
What Insurers Don’t Want You to Know
Most of the rate setting transparency you get as a customer is surface-level. Insurers will explain risk factors, but they do not itemize how much of your price is driven by competitive positioning and internal targets, because that logic lives inside proprietary pricing systems. Consumer advocates have been blunt that this creates car insurance pricing opacity, especially when companies can separate a risk-based price from an “optimized” price that reflects what they think you will pay without leaving.
That is why two identical drivers can get different quotes. It is not always about risk, it can be about pricing tiers, shopping behavior, and how a carrier positions itself against competitors in that ZIP-level market. State regulators have flagged this as an unfair discrimination issue in past investigations and bulletins on price optimization, because willingness-to-pay is not a loss cost.
The Call for Car Insurance Reform
The reform push is basically about one idea: if pricing is going to keep climbing, consumers want to see the logic, not a shrug. Advocacy groups have been pushing states to limit or ban non-driving factors (especially credit-based insurance scoring), crack down on price optimization, and require clearer disclosures about what changed at renewal. At the federal level, the conversation keeps resurfacing around unfair discrimination and the growing role of technology and data in personal auto pricing, but most action still happens state by state.
Proactive Monitoring Strategy
Annual Car Insurance Audit Checklist
If you only look at your policy once a year, you are basically letting the renewal happen to you. A yearly insurance cost review checklist turns it into something you control, even if the market is moving against you.
Here is the annual car insurance audit that keeps surprises small:
- Pull your CLUE report once a year and confirm the claims history is accurate.
- Check your MVR for tickets or accidents that do not belong there.
- Review your credit-based insurance score drivers, especially utilization and missed payments, because small credit shifts can show up as pricing shifts.
- Run at least five comparable quotes using the same limits and deductibles, so you are measuring price, not changing the product.
- Audit every discount on the declarations page and ask what you are eligible for but not receiving.
- Verify the coverage still matches your needs, especially comp and collision if the vehicle value changed.
- Document rate changes year to year, including what the carrier said changed.
- Check carrier financial strength and scan your state insurance department complaint summaries to avoid trading price for a bad claims experience.
Early Warning Signs of Rate Increases
Renewal hikes rarely come out of nowhere. Mid-term letters about “policy updates” are one of the biggest tells, because carriers do not spend money mailing updates unless something in underwriting, rating, or discounts is shifting. Discount removal notices are another obvious flag, especially if they are framed as an eligibility change rather than a cancellation.
Watch the broader market too. If you see repeated headlines about an insurer taking losses, tightening underwriting, or pulling back in your state, your renewal is unlikely to be gentle. The same goes for news that your state regulator is approving large rate filings for multiple carriers, or if your carrier gets a financial downgrade. On your own bill, new surcharges appearing, or a bill arriving earlier than expected, often means the carrier is trying to lock the new number in sooner.
Building Your Insurance Profile
You cannot control the market, but you can build a profile that insurers compete for. The long game is boring, but it works: protect your driving record, keep continuous coverage, and make your file easy to underwrite. Defensive driving is not a magic coupon, but it reduces the probability of the kinds of chargeable events that follow you for years, and it can unlock discounts in some states.
Claims management matters more than people think. Filing a claim is rational when the loss is large, but frequent small claims can be priced like a pattern, so it is worth doing the math on when to pay out of pocket versus when to involve the insurer. Pair that with a discount accumulation strategy: bundle if it is actually cheaper, verify mileage, update life changes promptly, and keep documentation. A simple folder with renewal pages, correspondence, and proof documents makes appeals and error corrections faster.
FAQs
Because rates move with claims costs in your area, not just your record. Repair, medical, theft, weather, uninsured driving, and litigation trends can raise the base rate. Non-driving inputs can also change quietly, like credit-based insurance scoring (where allowed) and neighborhood risk.
Split the change into three parts: coverage changes, surcharges tied to you (ticket/accident/lapse), and everything left. The “everything left” is usually the market-wide base rate move.
They need a justified rating plan, but the level of oversight depends on the state. Some states require approval before rates take effect, others review after filing, and some rely more on market competition.
Usually only if something changed, like adding a driver/vehicle, changing address, changing usage, or changing limits/deductibles. Most increases hit at renewal.
Many insurers use credit-based insurance scoring to predict claim likelihood. It is allowed in many states, restricted in some, and prohibited in a few. Higher utilization, missed payments, and closed accounts can raise your rate where this is used.
It is rarely truly the same. Small differences in mileage, garaging territory, claims history signals, prior insurance continuity, vehicle details, and credit-based scoring can change pricing. Shopping behavior can also matter in some markets.
Often they refresh it periodically and renewal is a common point. It is typically a soft inquiry, but practices vary by state and carrier.
It is a claims history report insurers use for underwriting. You can request your copy through the consumer request process, review entries, and dispute errors.
Usually the first move is a complaint to your state insurance department. Lawsuits are possible in narrow cases, but most disputes are handled through regulators and data corrections.
Commonly three to five years for pricing, depending on the state and carrier. Serious violations can affect eligibility longer even after surcharges fade.
It is rising lawsuit and settlement costs that push up injury claim severity. Those costs spread across all policyholders through higher premiums.
Sometimes. Renewal pricing can creep upward while new-customer offers stay sharper. The quick test is to quote the same coverage elsewhere and compare.
Usually a mix of high claim severity, theft/weather exposure, uninsured driving, litigation patterns, regulation, and limited carrier competition.
They model historical claim frequency and severity and adjust for inflation, repair trends, medical trends, and local loss experience, then reprice when reality changes.
It is pricing influenced by willingness-to-pay signals, not just risk cost. Some states restrict it and enforcement varies, so legality depends on where you live.
Not like haggling. You can request a discount audit, fix rating inputs, ask for a re-rate, and sometimes get retention credits. Comparable competing quotes help.
Negotiate when a discount or input looks wrong. Switch when the savings are meaningful on a truly comparable quote and you can avoid any coverage gap.
Good for direction, but the final price can change after verification of driving record, claims history, credit-based scoring, mileage, address, and VIN details.
They commonly use industry databases for claims and underwriting signals and buy third-party data. That is why checking CLUE and similar reports matters.
There is not one universal factor. In many cases, territory, vehicle repair exposure, driving record, and credit-based scoring (where allowed) dominate.
Pricing follows loss experience, not perception. Repair costs, theft, claim frequency, and litigation patterns can be higher in areas that still feel “nice,” and territories can be smaller than ZIP codes.
Industry-wide catastrophe losses can raise reinsurance and capital costs, which insurers spread across their book over time, not only the states hit.
Usually not, if it is legal in your state and the carrier uses it. Your alternative is choosing carriers operating under different rating plans, or living in a state that restricts it.
Dispute it with the report provider, keep documentation, then ask your insurer to re-rate after the correction posts.
Common misses include low-mileage bands, paid-in-full, multi-policy alignment, defensive driving, affinity/employer programs, and safety equipment credits. A discount audit is the fastest way to find them.
Table of contents
Looking for Auto Insuranse?
Make sure you’re not overpaying
You’ll be redirected to our partner’s website to compare personalized offers.
Advertiser Disclosure
RoadBuddy is a free resource that helps drivers compare auto insurance options.
We may receive compensation from some insurance companies and partners when you click on links or request a quote through our site. This may affect where offers appear, but it does not influence our reviews, guidance, or editorial decisions.
Our content is researched and written independently to give you clear and unbiased information.
By using RoadBuddy, you acknowledge and accept this disclosure. Learn more.